I had 14 years of data sitting around doing nothing. AI found the patterns hiding inside it.
We all leave behind mountains of data about ourselves — a watch, a scale, an app here and there — and almost never look back at it. I got curious what was actually hiding in mine, so I pulled fourteen years of it into one place, brought in some AI-assisted analysis, and went looking for patterns I couldn’t see day to day. What came out surprised me — and honestly, it’s a small preview of the kind of work I now do for a living.
A quick note before we start: I’m keeping the actual numbers private, so instead of my real weight I’ll call it X, and my goal X minus 7 lb. Everything else — the shapes, the patterns, the surprises — is exactly as the data showed it.
Some of what follows is practical; there’s a plan by the end. Most of it was stranger and more interesting: seven findings, two that overturn standard fitness advice, a seasonal rhythm I’d only half-suspected, and one predictive model that flat-out missed. Each comes with a short note on how it was done, for anyone curious about the “how.”
Method: three sources, one daily table
The hard part isn’t modeling, it’s reconciliation. Apple, Strava, and Withings measure overlapping things in different units and on different schedules, and my Watch, iPhone, and the Withings app all write the same metrics into Apple Health. Naive summing double-counts. Everything below runs on a de-duplicated, one-row-per-day frame built with pandas, statsmodels, and scikit-learn.
Finding 01 — A single weigh-in is mostly noise
The grey dots are individual weigh-ins; the blue line is the truth. On any given day my weight sits ±1.8 lb from my real trend — and one day in twenty, it’s off by more than 3.5 lb. That’s water, food, and sodium, none of which is fat.
Here’s the math that reframes everything: my entire seven-pound goal is barely twice the daily swing. Weigh yourself Monday, again Wednesday, and read the difference as progress, and you’re mostly reading noise. The number to trust isn’t today’s — it’s the trend under it.
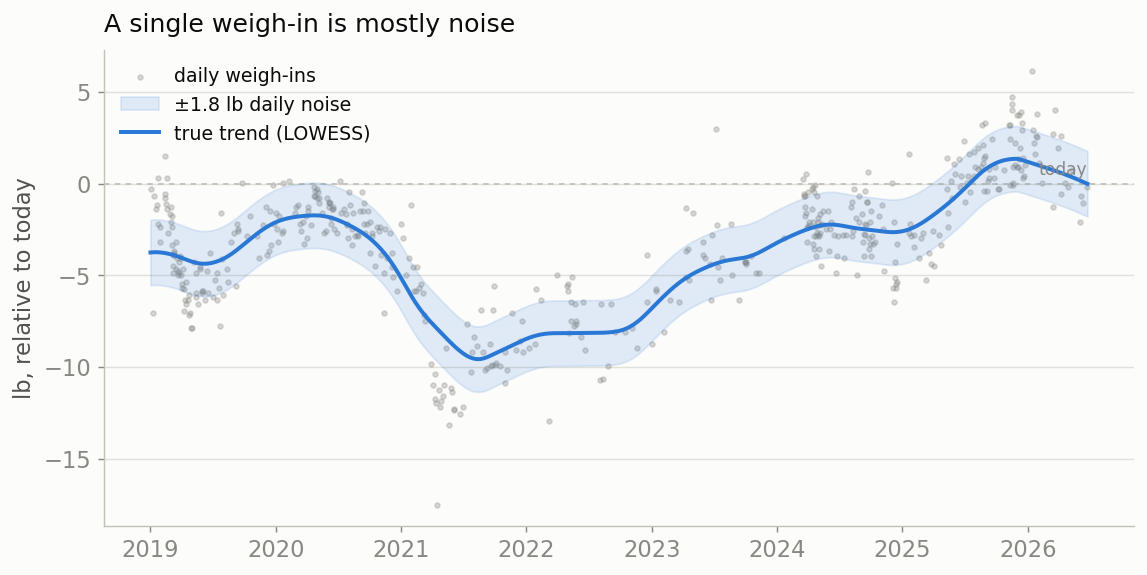 Individual weigh-ins (grey) vs the LOWESS trend (blue), plotted relative to today so the shape is visible without the actual number. The shaded band is one standard deviation of daily noise: ±1.8 lb.
Finding 02 — The weekend shows up on the scale on Monday
Subtract the trend and a weekly rhythm falls out cleanly. I’m +1.0 lb on Sunday and +0.6 lb on Monday relative to trend, and −0.3 lb every day from Wednesday to Friday. The weekend enters on Saturday, peaks on the scale by Monday, and washes out by midweek.
Two uses. A weigh-in that reflects reality happens Wednesday-to-Friday, not Monday. And the intervention doesn’t belong on a random Tuesday — it belongs on the weekend, where the surplus actually arrives.
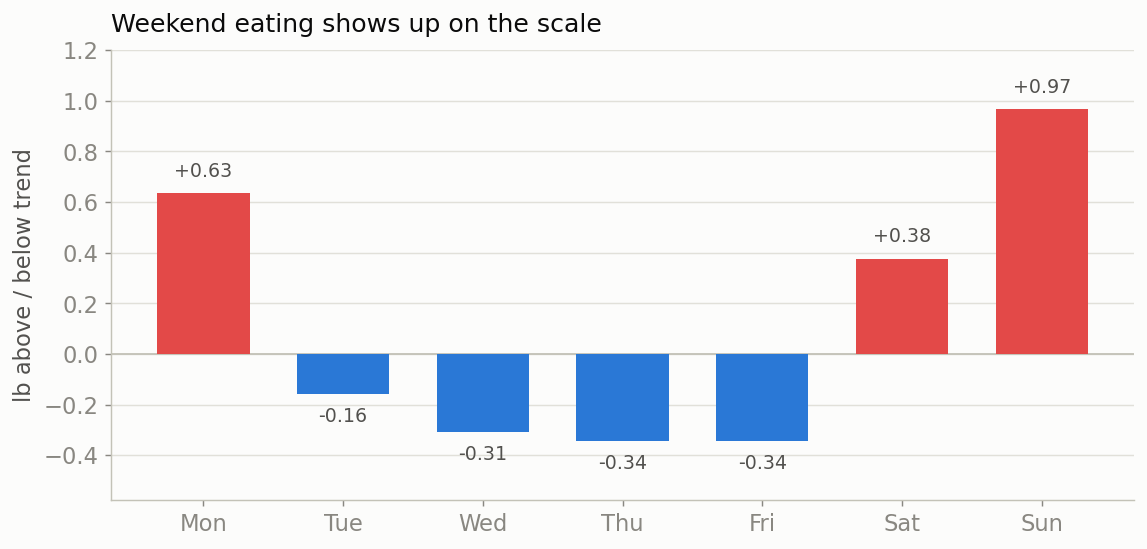 Average weight above (red) or below (blue) trend, by day of week. The weekend signature is unmistakable.
Finding 03 — My weight keeps a seasonal calendar
Stack enough years and a yearly rhythm appears that no single year could show. After removing the long-term drift, two seasons run heavy: early summer (June–July, +0.7 to +0.9 lb above trend) — pool, BBQ, and beer, right on cue — and late winter (January–March, +0.6 to +0.7). Two run lean: April, and October–November.
The twist I didn’t expect: December is one of my lightest months. The “holiday weight” doesn’t land over the holidays — it shows up in the new year, January through March, as the comfort-food season drags on. And the pattern holds across both halves of the 14 years, even though any single year is far too noisy to reveal it. That’s the whole reason to keep 14 years: the calendar only becomes visible once you stack them.
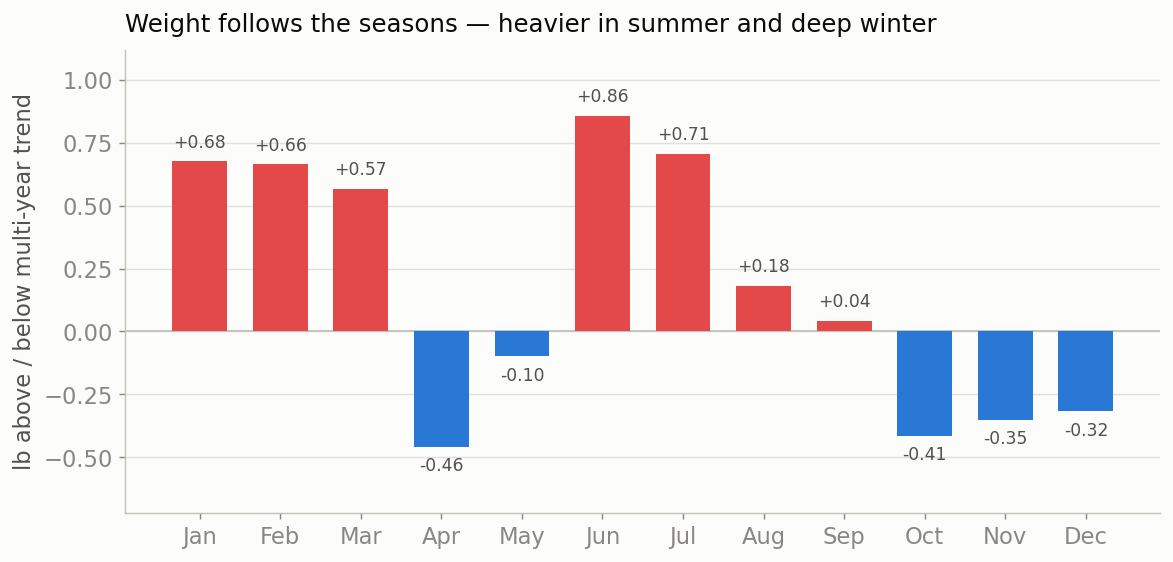 Weight relative to the multi-year trend, by month (14 years, 868 weigh-ins). Heavy in summer and late winter; lean in spring and fall.
Finding 04 — I cannot outrun my fork, and now I can prove it
The one I least wanted to be true. Does a high-activity stretch show up as a lighter scale four weeks later? Barely. The correlation is −0.07 — right direction, statistically indistinguishable from zero — and it gets weaker at longer lags, the opposite of what a real training effect would look like. For my body, at my activity level, movement is a rounding error on the scale. Diet is the lever.
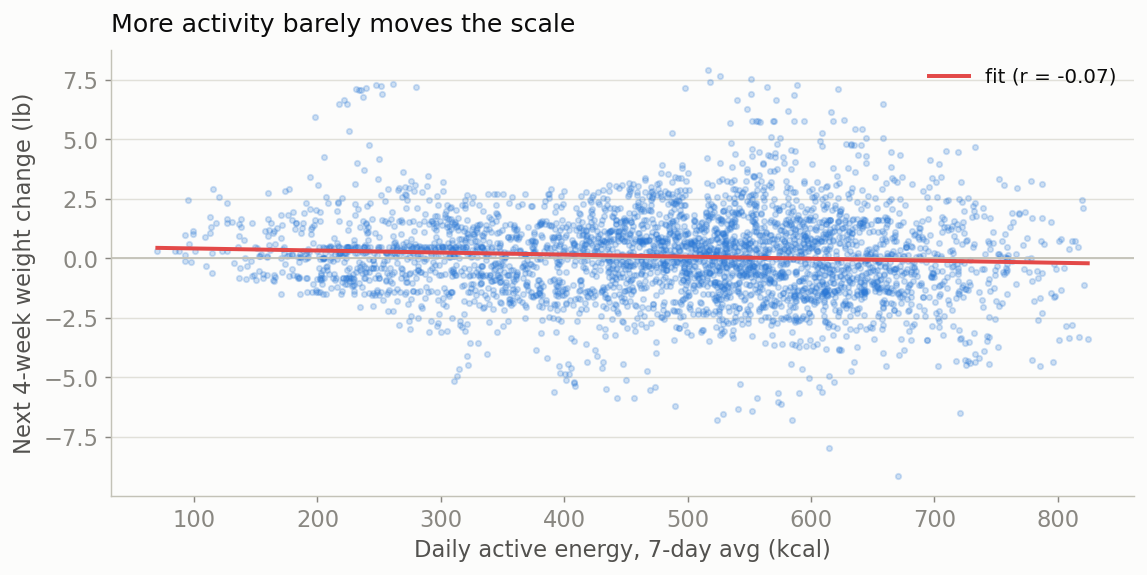 7-day average activity vs the next four weeks’ weight change. The fit line is essentially flat (r = −0.07).
Finding 05 — A slow fitness trend hiding under the noise
Apple estimates my VO₂max a few times a month. Month to month it jitters by about ±1 point, so in the app it looks like flat noise. Zoom out and it’s a different story: ~46 down to ~38 mL/kg/min, a 17% decline over six years. The month-to-month noise was large enough to completely hide a trend that’s actually huge.
A damped-trend forecast, which beats a naive baseline in backtesting, projects continued slow decline if nothing changes. This is the finding that reorganized my priorities: the weight is cosmetic, but the fitness line is a health trajectory, and it’s the one I most want to bend.
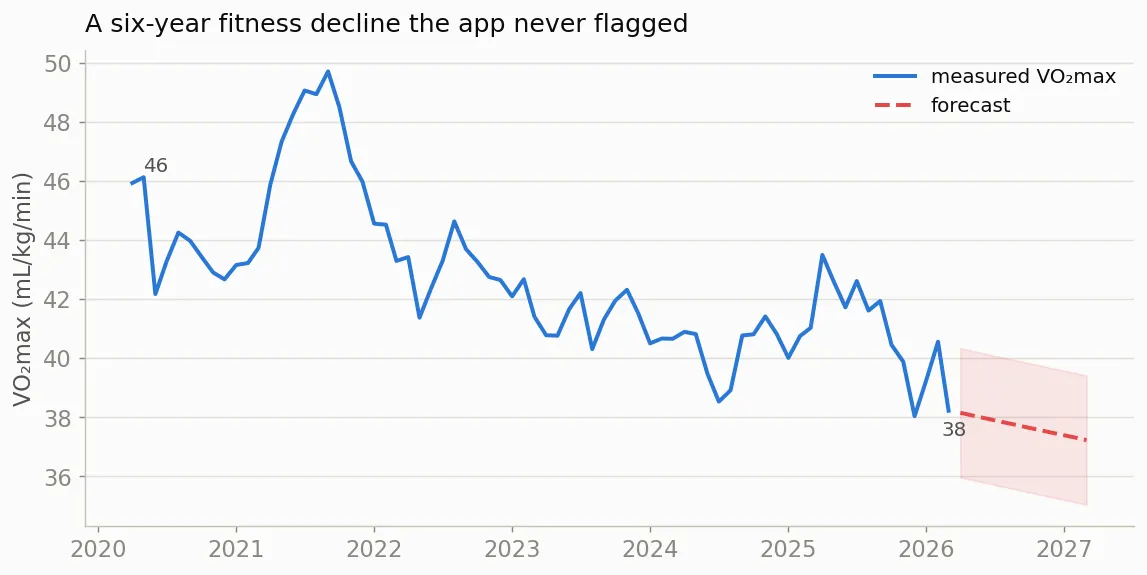 Measured VO₂max (blue) and a 12-month damped-trend forecast (red). The noise hid the trend; the trend is the story.
Finding 06 — The deficit you can’t feel
I burn about 2,462 kcal on an average day. Working backwards from my weight trend, I’ve been eating about 2,485. That gap is the whole story: +23 kcal per day of surplus — the energy in three almonds — hiding inside 2,500 kcal of daily throughput. Imperceptible by any instrument you own, including your own hunger.
It’s only recoverable by inverting the weight trend and letting the scale integrate it over months. This is the deepest reason weight management resists willpower: the signal that decides everything is smaller than the noise in every instrument you have.
Finding 07 — The textbook model that lost to doing nothing
I built the standard tool for forecasting fitness — a Banister fitness-fatigue impulse-response model, the logic behind every “training readiness” score. On my data it lost to a naive baseline; the fitted fitness term collapsed to essentially zero. The honest read: at my walking-dominated activity level, day-to-day training load simply doesn’t drive my fitness swings. Consistency over months does.
I’m keeping that result in. A model that can’t beat “assume nothing changed” is a finding, not an embarrassment — and if you never check against a naive baseline, you’ll ship the failure as a feature.
Predictive finale: where I’m actually headed
This last chart has to be read carefully, because two of its lines are honest and two are optimistic fiction. My weight is drifting slightly up; left alone, I never reach X minus 7. The question is which lever changes that — and it’s a trap I almost fell into.
The calorie-burn math says +2,000 steps/day melts the weight off. But Finding 04 already measured what added activity actually does to my weight — almost nothing — and that empirical line rides right alongside “do nothing.” The steps projection is theory my own data contradicts, undone by compensation: move more, and you eat a little more and fidget a little less. The one lever that holds up is the one the data pointed to all along.
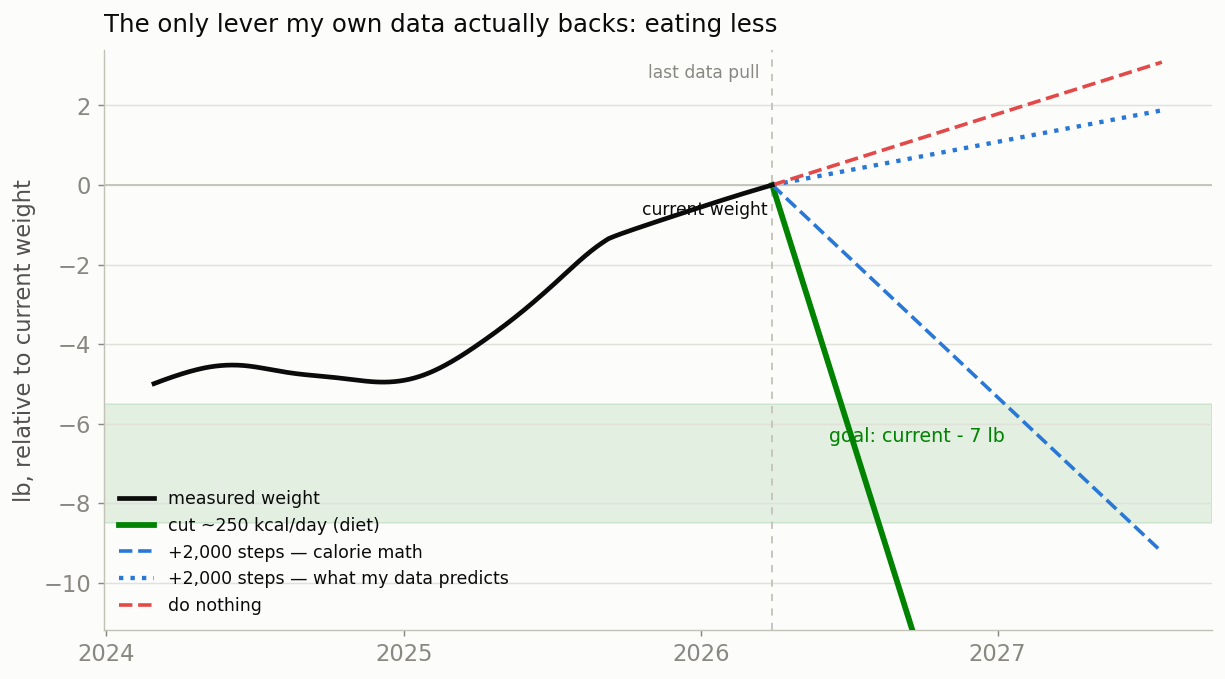 Measured weight (black) and four projections, both plotted relative to my current weight (0). The calorie-burn math (blue dashed) says steps work; my actual 14-year data (blue dotted) says added steps track “do nothing.” Only the intake cut (green) reaches the goal.
Here’s what each lever actually does, measured against my own 14 years of data:
- Cut ~250 kcal/day (diet): −0.45 lb/wk → reaches X minus 7 in about 4 months.
- +2,000 steps/day, calorie math (theoretical): −0.13 lb/wk → about 13 months.
- +2,000 steps/day, what my data actually predicts: +0.03 lb/wk → never.
- Do nothing: +0.05 lb/wk → never.
A modest cut of ~250 kcal/day gets me to X minus 7 in about four months, and unlike the steps line, it’s grounded in the energy-balance inversion from Finding 06, not a calorie-accounting fiction. So the plan writes itself — and it isn’t the one the fitness apps would sell me. Not more steps: a modest, sustained calorie trim aimed at the weekend, braced for the summer and late-winter bumps. The walking still matters, just not for the scale — it’s there to bend the six-year fitness line back up.
What I actually changed
- Weigh daily, read only the weekly trend. Single numbers are noise; I stopped reacting to them.
- A modest calorie deficit, aimed at the weekend — the one lever my own data backs for weight.
- Brace for the heavy seasons — lighter defaults through June–July and January–March.
- Keep walking, but for fitness, not the scale. Zone-2 aerobic twice a week to bend a six-year fitness decline back up.
- Re-check the forecast quarterly as new data lands.
The meta-lesson: the thing that matters is smaller than the noise around it
Every finding here has the same shape: the decisive signal is tiny, and only visible after you fuse sources and integrate over time. Your phone shows you today’s number. The value was in fourteen years of them — de-duplicated, de-noised, and honestly backtested, including the model that failed.
Why I’m sharing this
None of this data was ever meant to be looked at together. A watch, a scale, an app — each one sees a sliver, and nobody had connected the slivers, so the real patterns just sat there invisible. That’s true of nearly every business I’ve looked at too: the answers are usually already sitting in the data somewhere, scattered across tools that don’t talk to each other. Someone just has to go looking, ask the right questions, and check the answers honestly (including admitting when a model doesn’t work, like Finding 07).
That’s the work I do now. If you’re curious what’s hiding in your data, I’d love to talk.
Built with Python (pandas, statsmodels, scikit-learn). Data: Apple Health, Strava, Withings. Actual weight figures have been anonymized to a relative scale.